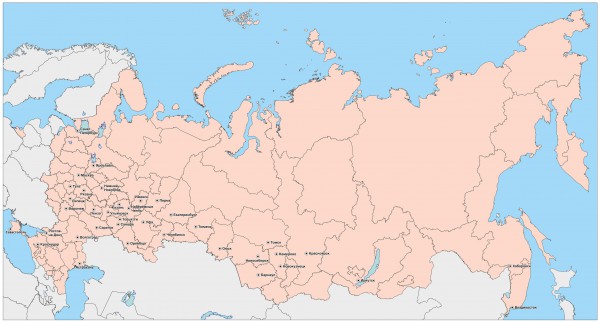
Why Vector Maps Beat Raster Every Time

Let's be blunt. If you've ever tried to print a JPEG of Russia at poster size, you already know the pain. Pixelation. Blurry borders. Jagged coastlines that look like a game from 1994. Vector maps solve all of that. They don't store pixels. They store mathematical paths. A line is a line — not a sequence of coloured squares. Scale it to 10 metres wide and Kamchatka still looks sharp.

The file we're sharing today covers the full territory of the Russian Federation, including the Crimean Peninsula. Formats: PDF, CDR (CorelDRAW), and SVG. All three in one ZIP. The map is structured into logical layers — country borders, regional boundaries, water bodies, and major cities. You turn layers on and off as needed. Want just the coastline? Hide the regions. Need to highlight Siberia? Duplicate that layer, add a colour fill, done.

All files in this download are free for personal and commercial use. No attribution required, though a link back to photolessons.org is appreciated.

Here's what you get inside the archive:

FormatSoftwareEditable?Best For
PDFAdobe Illustrator, Inkscape, AcrobatYes (in vector editors)Print, sharing with clients
CDRCorelDRAW X3+YesProfessional design studios
SVGAny browser, Inkscape, IllustratorYesWeb, infographics, GIS tools
Download karta_rossii.zip~8 MB

Layers and What You Can Actually Edit

This isn't a flat image with a .svg extension slapped on it. This is a properly structured vector file. Every region boundary is a separate path. Every river is a curve you can select, delete, or recolour. That matters when you're building an infographic that needs 15 highlighted regions with custom labels.

The layer structure looks roughly like this:

  • Country outline — the external border of the Russian Federation
  • Federal subjects — 85 regions (republics, krais, oblasts, autonomous okrugs)
  • Crimea — separate layer with the peninsula's administrative boundaries
  • Major rivers — Volga, Ob, Yenisei, Lena, Amur
  • Lakes — Baikal, Ladoga, Onega, Caspian Sea shoreline
  • Cities — Moscow, Saint Petersburg, Novosibirsk, Yekaterinburg, and 50+ others
  • Neighbouring countries — simplified outlines for context

Layer management is where vector maps earn their keep. Need a map showing only European Russia? Hide everything east of the Urals. Compiling a report on Siberian resources? Isolate the Siberian Federal District and colour it independently. The flexibility is absurd compared to raster alternatives.

Vector Map Formats Compared: PDF vs CDR vs SVG vs AI

Not all vector formats are equal. They serve different purposes, and picking the wrong one causes friction downstream. Here's a honest comparison based on years of swapping files between designers, printers, and developers.

FormatOpen Standard?Text PreservationLayer SupportBrowser Viewable?File Size
SVGYes (W3C)Yes (as text)Yes (<g> tags)Yes, nativelySmallest
PDFYes (ISO 32000)YesOptional (OCG)Most browsersMedium
CDRNo (proprietary)YesYes (full)NoLargest
AI (Adobe)No (proprietary)YesYesNoMedium-large
EPSSemi-openConverted to curvesNoNoLarge

SVG wins for web and GIS integration. PDF is the universal exchange format — any printer accepts it. CDR is CorelDRAW's native format and if your workflow runs on Corel, it's the only sensible choice. EPS is legacy at this point; we don't include it because SVG replaced it years ago.

\u{201c}

If a map format can't be opened by at least three different programs, it's not a real exchange format.

Cartography Rule of Thumb, Design Wisdom

Crimea on the Map: Boundaries and Administrative Context

The map includes the Republic of Crimea and the federal city of Sevastopol as constituent entities of the Russian Federation. The peninsula is rendered with its full administrative boundaries — city districts, major roads, and coastline detail down to the major bays: Sevastopol Bay, Feodosia Bay, Kerch Bay. The Kerch Strait, connecting the Black Sea and the Sea of Azov, is clearly delineated.

For cartographers working on thematic maps, Crimea adds an interesting challenge. The peninsula sits at roughly 45 degrees north latitude — the same as northern Italy and southern France. Its geography is diverse: the Crimean Mountains along the southern coast, the steppe in the north, and the indented coastline that gave the peninsula its strategic value for millennia. A good vector map captures all of this without the coastline turning into a smudge at high magnification.

The map's scale is approximately 1:8,000,000 — detailed enough to show regional boundaries and major cities, but not so detailed that every village road becomes a tangled mess. That's the sweet spot for presentation maps.

Practical Applications: Where This Map Gets Used

Over the years, this map has found its way into wildly different projects. Here's a sample of what people actually do with it:

  • Logistics companies plotting delivery zones across Russia's 11 time zones
  • Newsroom infographics — election results by region, colour-coded and overlaid on the vector base
  • Educational posters — geography classrooms printing wall-sized maps with custom annotations
  • Tourism brochures — highlighting Trans-Siberian railway stops from Moscow to Vladivostok
  • GIS preprocessing — importing SVG paths into QGIS or ArcGIS as a reference layer
  • Startup pitch decks — every Russian startup raising money needs a "market coverage" slide with a map
  • Academic papers — ecological studies mapping species distribution across Russian biomes

Each use case demands something different from the map. The logistics company strips away everything except borders and cities. The newsroom adds red/blue fills. The academic adds latitude/longitude grids. The vector format makes all of these possible from a single source file.

Working with the SVG in GIS Tools

If you're into GIS, you'll want the SVG. QGIS (the free, open-source Geographic Information System) imports SVG paths directly. Here's the workflow:

  1. Open the SVG in Inkscape (also free). Remove any decorative elements you don't need.
  2. Select the paths you want to georeference — typically the country outline and regional borders.
  3. Save as a clean SVG with only the paths you need.
  4. In QGIS, use the Import SVG function or convert to GeoJSON via an online tool.
  5. Assign a coordinate reference system (EPSG:4326 for WGS84 works for Russia's extent).
  6. Overlay your data layers — population density, climate zones, whatever you're mapping.

The SVG paths in this map are already clean — no unnecessary nodes, no broken curves, no weird artifacts from auto-tracing. That saves hours of cleanup compared to maps sourced from raster-to-vector conversion.

For precise GIS work, this map is a reference layer, not a geodetically surveyed dataset. It's accurate enough for infographics, presentations, and thematic mapping. Don't use it for property boundary disputes.

Printing Tips: Getting the Output Right

Vector files print beautifully — if you set them up correctly. Here's what trips people up:

  • Stroke width scaling. By default, map borders might be 1pt at A4. Blow it up to A0 and those borders become hairline thin. Scale your strokes proportionally or check "Scale strokes and effects" in Illustrator.
  • Colour mode. Vector maps often come in RGB. Printers need CMYK. Convert before sending, and expect some color shift — especially in blues. RGB cyan looks different from CMYK cyan.
  • Font embedding. If the map has city labels in a specific font, embed it or convert to outlines. Otherwise the printer substitutes Courier and your map looks like a 1990s terminal.
  • Overprint and trapping. Not usually an issue for maps, but if you're overlaying opaque fills on borders, check the overprint settings.

For most users, the PDF in this archive is print-ready out of the box. Open, set your page size, scale to fit, print. The SVG and CDR versions give you more editing control but require those extra checks before sending to a commercial printer.

Color Schemes and Legends: Designing Thematic Maps of Russia

A map without a legend is just a pretty picture. A map with a legend is an analytical tool. Thematic cartography is its own discipline, and the vector format gives you maximum flexibility here. You're not locked into the original colours. Want to show population density by region? Grab the federal subjects layer, assign a colour scale from pale yellow (sparsely populated) to dark red (densely populated). Want to show GDP by region? Different scale. Climate zones? A third scale.

Here are some tested colour schemes for Russian maps:

  • Political (standard): each region gets its own pastel tone. No adjacent regions share the same colour. Four to five colours cover the entire map thanks to the four-colour theorem, but designers typically use six to eight shades for better readability.
  • Administrative (federal districts): districts grouped by colour. Central Federal District in the blue spectrum, Northwestern in green, Southern in orange, and so on. Helps viewers instantly identify macro-regions.
  • Sequential gradient (quantitative): one hue at varying saturation. Good for statistical indicators — darker shade means higher value. Visually intuitive.
  • Diverging (comparative): two contrasting colours with a neutral centre. Blue for regions with population growth, red for decline, white for stable. Excellent for above/below-average comparisons.

And about legends — the vector nature of this map lets you create the legend right inside the file, on a separate layer or artboard. No need to draw it in another program and wrestle with alignment. Everything in one document: map, legend, scale bar, compass rose. Export with one click and the PDF is print-ready.

Real-World Case Studies: How People Actually Use This Map

Over the years, users have shared some memorable projects. Here are a few that stuck:

Case 1: Regional pharmacy chain. A marketing manager for a chain of 200 pharmacies across 15 regions used the CDR version to plot store locations and logistics coverage zones. Regions without pharmacies were greyed out. Their own regions — highlighted in brand green. The map was printed on a 3x2 metre banner for the annual franchisee meeting. It looked an order of magnitude more professional than a Yandex Maps screenshot with pushpins.

Case 2: Economic geography dissertation. A PhD student used the SVG version for a series of 12 thematic maps showing migration flows between federal districts from 1991 to 2020. In QGIS, they overlaid Rosstat data on the vector base, set up flow arrows, and colour-coded donor and recipient regions. Every map in the dissertation — consistent style, same legend, same scale. The defence was successful.

Case 3: Classroom project. A geography teacher in Novosibirsk printed the map across eight A4 sheets, taped them into a wall display, and let students colour in regions as they studied them. Over the year, the map transformed into a colourful canvas with marker annotations, stickers, and handwritten notes. By year's end, the students knew all 85 federal subjects — not through rote memorisation, but through that map on the wall.

Same source file. Radically different applications. That's the point of a vector master — it doesn't prescribe how to use it. It provides a platform, and you decide the rest.

Alternatives and Competitors: Where Else to Get a Vector Map of Russia

The vector map market is competitive. If this file doesn't fit your needs for any reason, here are the alternatives with an honest assessment:

SourceFormatsPriceProsCons
Natural Earth (naturalearthdata.com)Shapefile, GeoJSONFreeOpen data, precise georeferencing, regular updatesGIS formats only, no CDR/PDF, Crimea not shown as part of Russia
Freepik / VecteezyAI, EPS, SVGFree / PremiumMany styles, often designer-polishedBoundaries may be outdated, no guarantee of clean paths
Shutterstock / Adobe StockAI, EPS, JPEGFrom $10Professional quality, licensing clarityPaid, often without regional subdivisions
OpenStreetMap (export)SVG, PDF (via Maperitive)FreeStreet-level detail, community dataOverkill for presentations, needs layer filtering
This file (photolessons.org)PDF, CDR, SVGFreeThree vector formats, Crimea included, layered structure, no registration1:8M scale — not suitable for ultra-detailed projects

For quick presentations, educational projects, or commercial brochures, this file covers 90% of needs. For GIS analysis with precise georeferencing, Natural Earth is better. For designer projects with artistic polish — Shutterstock. But for everything else — here it is, one ZIP archive, no registration, no SMS.

FAQ

What file formats are included in the download?

The ZIP archive contains the vector map in three formats: PDF, CDR (CorelDRAW), and SVG. All three are editable vector files — no raster formats included. You get one archive, karta_rossii.zip, with all three inside.

Is the map editable in Adobe Illustrator?

Yes. Illustrator opens both PDF and SVG natively. The PDF preserves all layers and paths. The SVG also imports cleanly. You can select individual regions, change colours, add labels, or remove elements as needed.

Does the map include Crimea?

Yes. The Republic of Crimea and the federal city of Sevastopol are included as constituent entities of the Russian Federation, with full administrative boundaries drawn on the map.

What scale is the map?

The map is approximately 1:8,000,000. It shows federal subjects (regions), major cities, rivers, lakes, and surrounding countries. It's designed for presentations and infographics — detailed enough to show regional divisions without overwhelming the viewer with every single village.

Can I use this map for commercial projects?

Yes. The map is free for both personal and commercial use. You can include it in client presentations, printed materials, websites, and educational products. Attribution to photolessons.org is appreciated but not required.

Does the map work in Inkscape?

Absolutely. Inkscape opens SVG files natively and handles this map without problems. PDF import in Inkscape is also reliable for this file. Inkscape is free and open-source — if you don't have Illustrator or CorelDRAW, it's your best option.

Can I separate individual regions from the map?

Yes. The map is built with layers and grouped paths. Open the SVG or CDR in your editor, find the region you need in the layers panel, ungroup if necessary, and copy or extract it. Each federal subject is a distinct path object.

What's the difference between the SVG and PDF versions?

Both are vector and editable. SVG is a web standard — smaller file size, viewable in any browser, and integrates easily with HTML/CSS/JavaScript for interactive web maps. PDF is more universal for print — any print shop accepts it, and it embeds fonts and metadata more robustly than SVG.

Is the map georeferenced for GIS use?

No. This is a reference vector map, not a geodetically surveyed dataset. The paths are accurate for visual representation but are not tagged with coordinate reference system metadata. For GIS work, you can manually georeference the paths in QGIS or ArcGIS, but for precise spatial analysis you should use official shapefile data from Rosreestr or Natural Earth.

How do I change the colour of a specific region?

Open the file in Illustrator, CorelDRAW, or Inkscape. Select the region's path with the direct selection tool. Apply a new fill colour. Because the map uses vector paths, each region is independently selectable and colourable. No masking or pixel-painting required.

Tap to react