Векторная карта Белоруссии с областями и городами
Скачать векторную карту Республики Беларусь (Белоруссии) с обозначением областей, городов и дорог в форматах svg, cdr и pdf одним архивом: karta_belorussii.zip
Tap to react
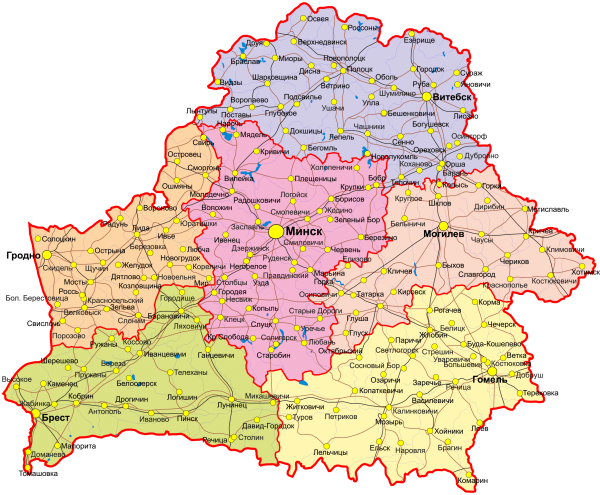
Векторная карта Белоруссии с областями и городами
Tap to react